
Trading charts are one of the most important tools in your investing arsenal. But understanding Renko from Heikin Ashi and judging the best intervals from intraday scalping to 5-minutes and 1-hour can be challenging. This guide breaks down the best trading charts in 2023, including bar, candlestick, and line versions. We also explain how to set up and interpret your own. Finally, we share tips on where to get the best free and paid-for charting software.
Live Chart
All the live price charts on this site are delivered by TradingView, which offers a range of accounts for anyone looking to use advanced charting features.
Best Charts For Day Trading
There are many different online charts, from Heiken Ashi to Magi and Tick charts. Your task is to find one that best suits your trading style.
Importantly, each chart has its benefits and drawbacks and there are many variations, like points and figures.
Day trading using candlestick and bar charts is particularly popular as they provide more information than a simple line chart.
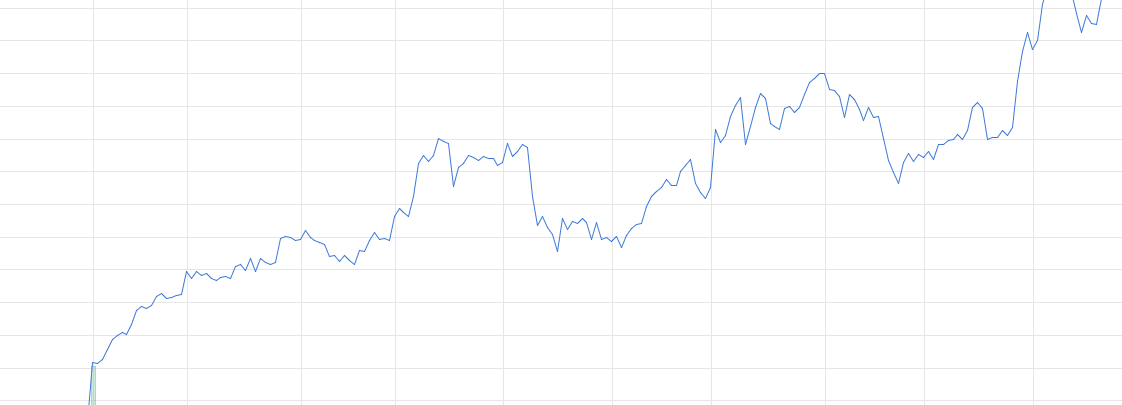
Line Charts
One of the most popular types of intraday trading charts is line charts. They give you the closing figure. You still opt for a time frame, but the chart will only display the closing prices for that period, say 5 minutes. Each closing price will be connected to the next closing price with a continuous line.
A line chart helps cut through the noise and offers a brief overview of where the price has been. They are particularly useful when drawing trend lines because they hide all the trading noise. However, you wouldn’t want to base your investment decisions solely on this data as essential information is missing.
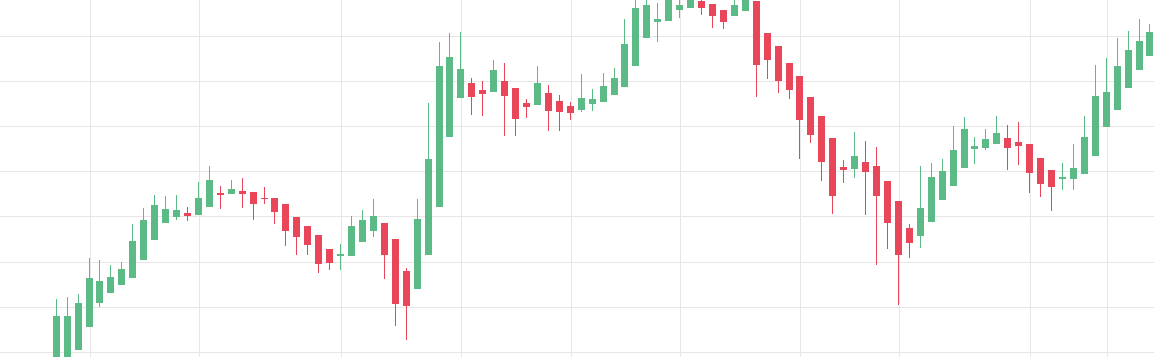
Bar & Candlestick Charts
Most trading charts you see online are bar and candlestick. They give you the most information in an easy-to-navigate format. Put simply, they show where the price has moved within a specified time period.
The size of the bar/candle depends on the time frame you opt for. Let’s say that the price bar or candle is generated every 5 minutes. Bar and candlestick charts will show the cost of the first transaction at the beginning of that 5 minutes, plus the highest and lowest transaction prices during that time. In addition, you also see the final (closing) price of any time frame you trade with.
Note, you can find more tips about the best intervals for day trading charts below.
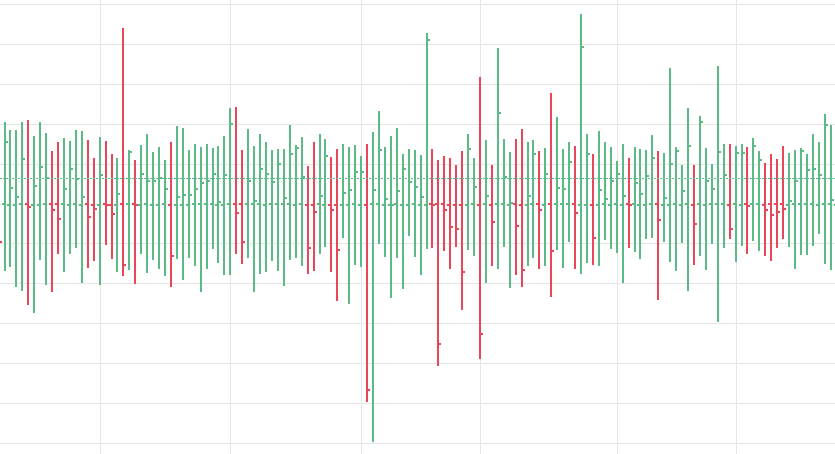
Bar Charts
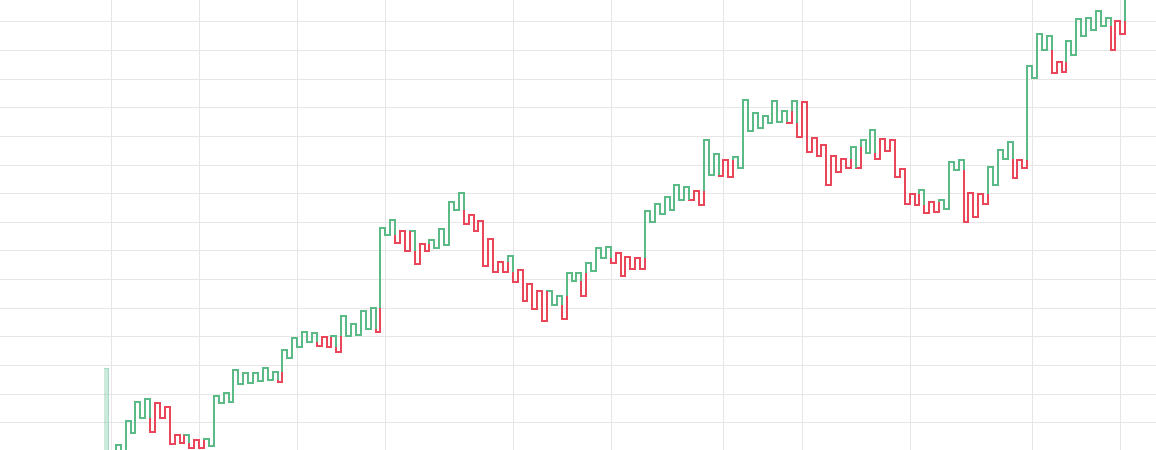
Bar charts consist of vertical lines representing the price range in a specified period.
The horizontal lines show the open and closing figures. If the opening price is lower than the closing price, the line will usually be black and red. If the opening price is higher than the closing price, the line is green.
Bar charts effectively extend line charts, adding the open, high, low, and close. They remain relatively straightforward to read while giving you some crucial information line charts fail to do.

Tick
Day trading with tick charts isn’t common, but some swear by it. The bars on a tick chart develop based on a specified number of transactions. So, a 415 tick chart creates a new bar for every 415 transactions, for example.
They allow you to time your entries with ease, hence why many claim tick charts are best for day trading. They won’t be impacted by time, so when there is high investing activity, you may have a bar form every minute, but it may take several hours if there is slow trading. This means in high-volume periods, a tick chart will show you more crucial information than many other variations.
Candlestick Charts
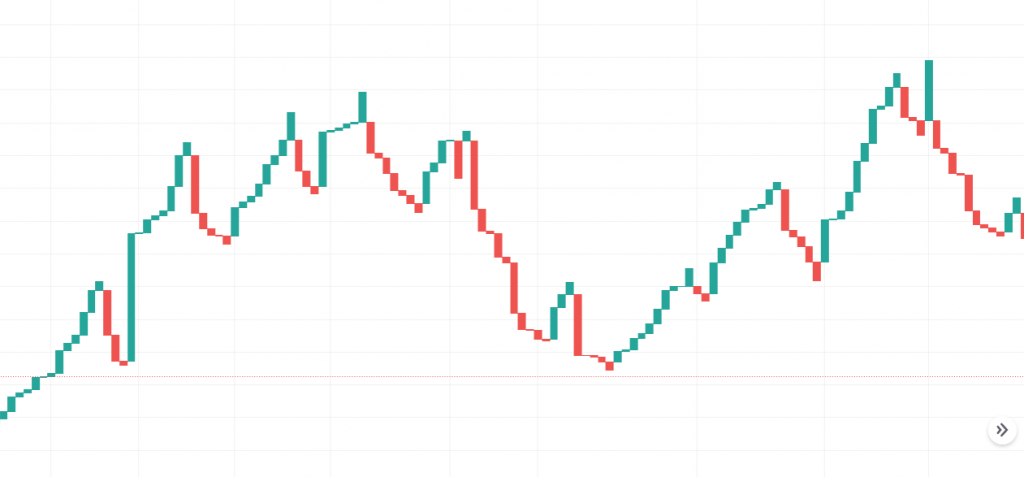
Heikin-Ashi
If you’re day trading, a Heiken-Ashi charts pdf will probably come across your screen at some point.
This form of candlestick chart originated in Japan in the 1700s.
So, why do investors use them? Because they filter out unnecessary information and provide a clear view of trends. This makes them ideal for beginners, but they also come in handy for experienced traders. The Heiken-Ashi chart helps keep you in trending trades and makes spotting reversals straightforward.
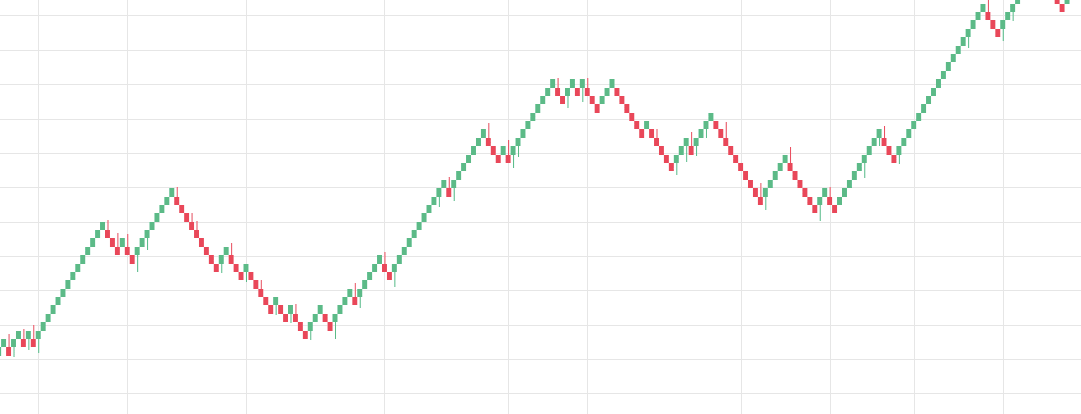
Renko
If you’re looking to ease into day trading with charts, consider a Renko. “Renko” comes from the Japanese word for bricks, “renga”. This type of chart only shows price movement and doesn’t provide any time or volume indications. Once the price exceeds the previous brick’s top or bottom, a new brick is placed in the next column. White/green bricks indicate an upward trend, while black/red bricks indicate a downward trend. Renko charts are particularly useful for identifying key support and resistance levels.
Kagi
A Kagi chart requires you to specify the reversal amount in percentage or price change. The chart changes direction once the price turns in the opposite direction by the predetermined reversal amount. Kagi charts display different line widths.
The line will thicken if the market gets higher than a previous swing. Likewise, the line will thin when it heads below an earlier swing.
They are suitable for day trading because they emphasize the break-out of swing highs and lows. They are also useful for finding support and resistance levels, enabling you to track market bias.
Breakline
The breakline chart is similar to Renko and Kagi. It shows price movements and omits time intervals. Breakline uses down bars and up bars to illustrate rising and falling prices.
A breakline chart compares the previous line’s closing figure with the most recent line. When the price goes up the following line is higher, but if the price falls the next line goes below the previous line. If the price does not move after an elapsed time frame, no line would be drawn.
Timing Setup
Online you will see a lot of day trading 1, 5, 15 and 30-minute charts. All charts have a time frame, usually on the x-axis, which will determine the amount of information they display.
While most charting options are based on time, some will focus on the number of trades. The most common are:
- Tick
- Time
- Volume
- Price range
A 1-minute chart is an example of a time-based option.
Every minute, a new price bar will form, showing you the price movements for that minute. Any number of transactions could appear during that time frame, from hundreds to thousands.
Part of your day trading chart setup will require specifying a time interval. If you are not planning to be glued to your screen all day, you will probably want to use a lower time frame. If you plan to be there for the long haul, perhaps a higher time frame would better suit you.
If you are trading for just a few hours, a 15-minute chart will only create a limited number of bars. No matter how good your chart software is, it will struggle to generate a helpful signal with such little information.
Indicator Issues
There is another reason you need to consider time in your chart setup for day trading – technical indicators. Not all indicators work the same with all time frames. You may find lagging indicators work the best with less volatility, such as moving averages. You might then benefit from a longer period moving average on your daily chart than if you used the same setup on a 1-minute chart.
There is no wrong and right answer when it comes to time frames. When you are reading charts for day trading, just bear these few things in mind. Firstly, how long will you be at your screen, waiting for signals to show? Secondly, what time frame will the technical indicators you use work best with?
Understanding Day Trading Charts
So, you have set up your chart.
But now, you need to get to grips with day trading chart analysis. Having a chart with all the answers is no use if you can’t decipher the lines, ticks, and bars to get your hands on them.
Technical Indicators
Add too many indicators, and you will be left with a sea of colors and lines that will only slow down the decision-making process. Many investors clutter their charts and are left unable to interpret all the data. Instead, consider some of the most popular indicators:
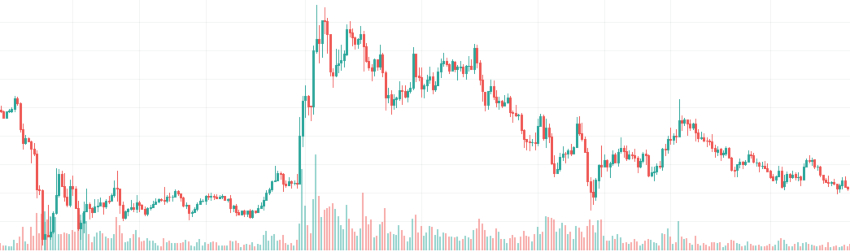
- Volume indicator – It won’t tell you how the price will go. However, it will let you know if there are many transactions being made and whether the big players are in the game.
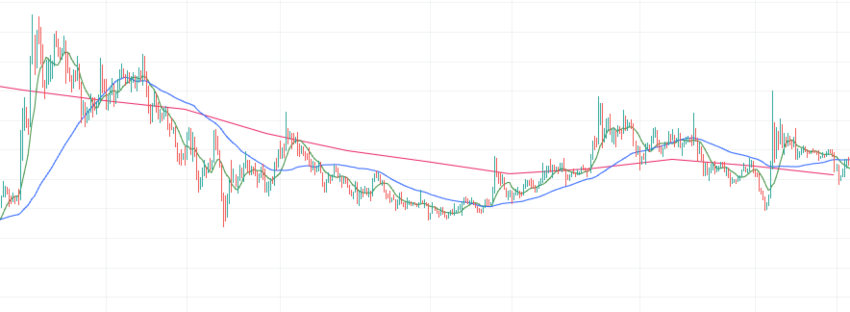
- Simple moving average (SMA) – A 10-period moving average is one of the most prevalent indicators amongst intraday traders. It will highlight a significant price move early and show you in which direction. Opt for a slower moving average, and you may lose profit when the trend ends or reverses.
- Average true range (ATR) – J.Welles Wilder developed this indicator. It shows an accurate depiction of volatility based on the actual price of the instrument.
- This gives you no choice but to assess each security individually, ensuring precise decisions are made.
- Oscillators – These are a group of indicators that usually flow between the upper and lower bounds.They come in handy when a trend is not visible.The most popular are RSI, MACD, Stochastic Oscillator, and Commodity Channel Index (CCI).
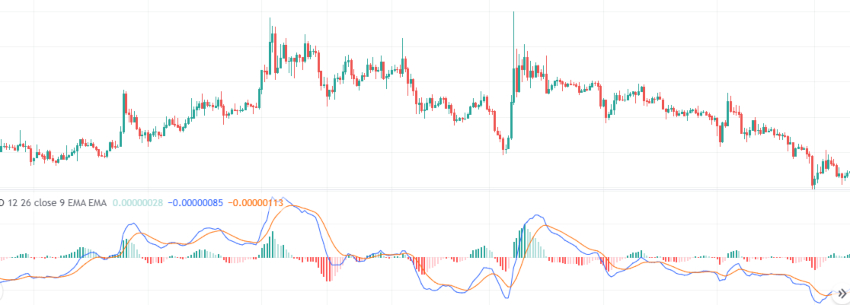
Chart Patterns
With thousands of opportunities on your chart, how do you know when to enter and exit a position?Well, you have to look out for the best day trading patterns.Patterns help you predict future price movements and they work on the basis that history repeats itself.
Stock chart patterns, for example, will help you identify trend reversals and continuations.You will usually find two themes in your chart analysis, breakouts and and reversals.The former is when the price clears a pre-determined level on your chart.The latter is when there is a change in a price trend.
Some of the most popular patterns are listed below.
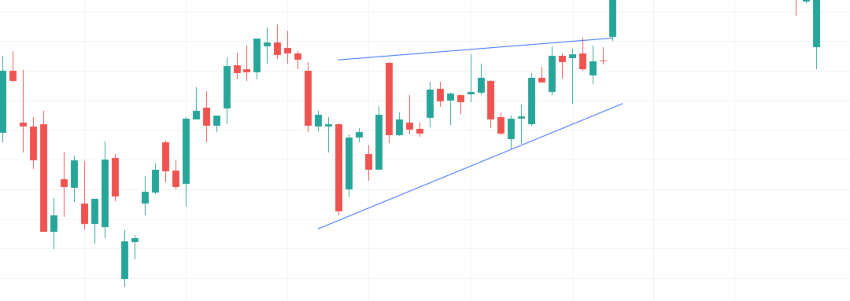
Ascending Triangle
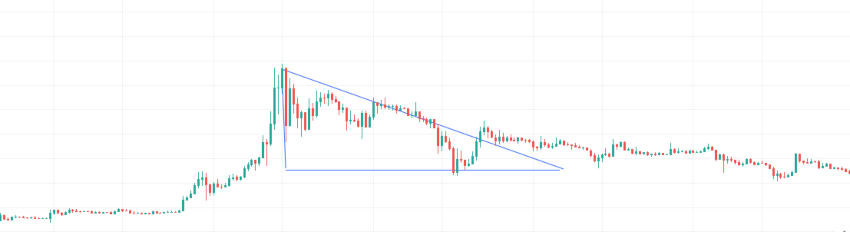
Descending Triangle
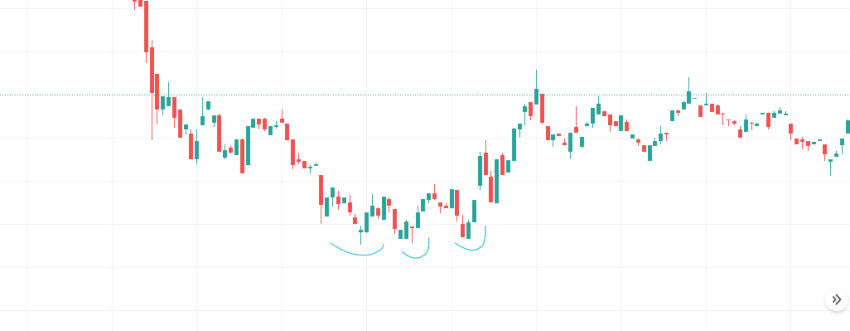
Triple Bottom
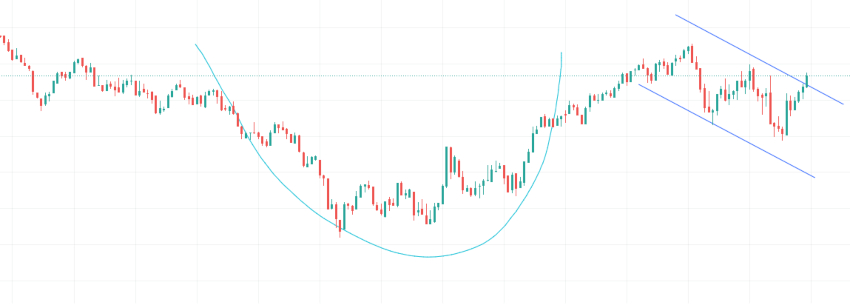
Cup and handle
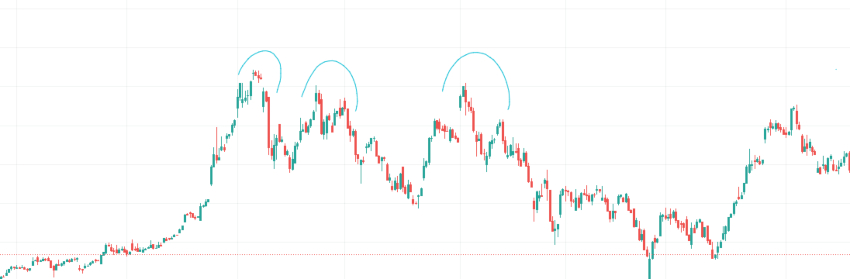
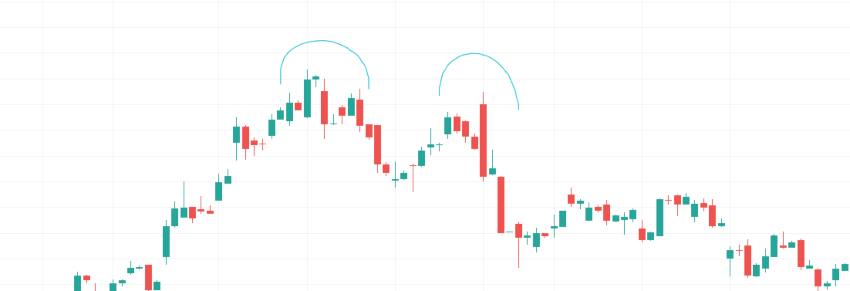
Triple Top
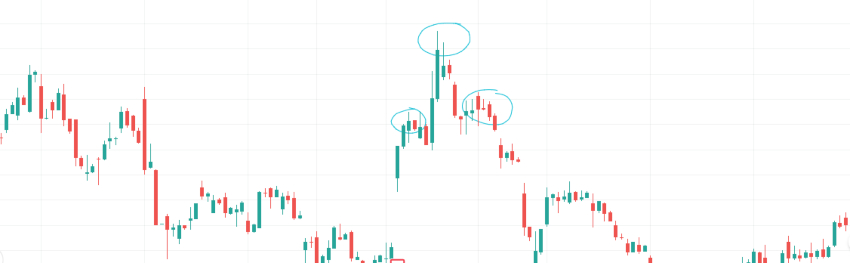
Head and Shoulders
Double Top
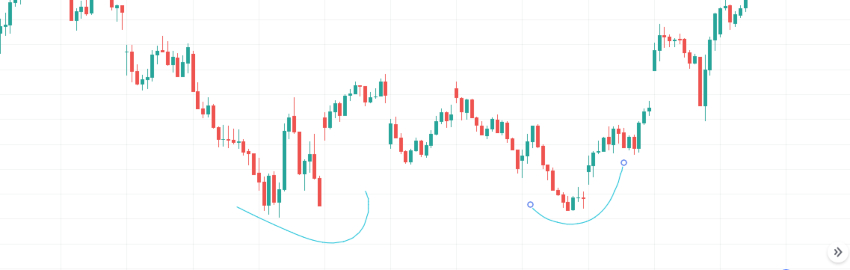
Double Bottom
Other less known options include morning consolidation, late consolidation, little to no price retracement, spring at support, outside bar at resistance or support, pennant, and more.
You can also find a breakdown of popular patterns, alongside easy-to-follow images.
How to use Trading Charts
It is no news that charts show real-time prices and price history.
Taking note of recurring patterns and their outcomes will help solidify a strategy.
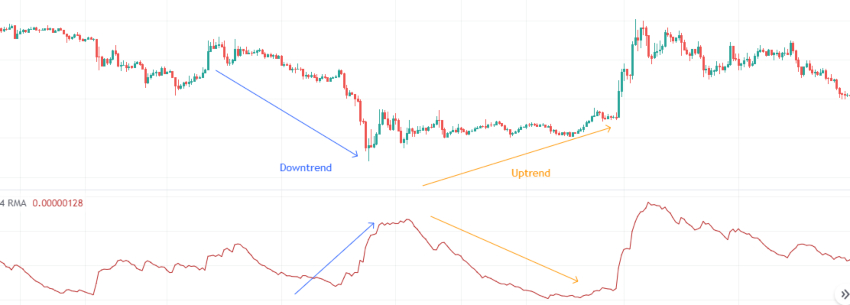
Technical analysis is the most common reason people use charts. The basics of technical analysis are identifying support and resistance, trends, and trend reversals. Some indicators can help with this, including moving averages, pivots, and MACD.
For traders new to investing, TradingView is one of the best places to view many different charts alongside indicators. The platform allows access to various indicators, assets, time frames, and even has a demo account. Charts can be used in different ways to test investment strategies.
Backtesting is also an excellent way to use charts and indicators. When you want to get a reasonable hypothesis for a strategy, you can backtest the strategy on a demo account to know its success rate and how it typically plays out.
There are also many other ways investors can use charts. You may monitor the market and see how price reacts at various zones or even view the impact of historical events on price. It all depends on what you want to do at that point in time.
Software
You can find a whole range of charting software, from apps to web-based platforms. The best charting software will allow you to create visually appealing charts easily. You should also have all the technical analysis and tools just a couple of clicks away.
Most brokerages offer charting software, but some traders opt for additional, specialized software.
If you are new to day trading using charts, then the standard software you get from your broker should meet your needs.
All of the popular charting software below offer line, bar, and candlestick charts. They also all have extensive customizability options:
- MetaTrader – This platform is ideal if you are looking for forex daily charts. Investing with MT4 and MT5 offer in-depth and easy-to-navigate charting solutions. You also get numerous time frames to choose between.
- TradeStation – You benefit from flexibility and multi-data charts. On top of that, you get access to indicators with alerts and several intelligent drawing tools on TradeStation.
- NinjaTrader – This low-cost integrated trading and charting software system offers crystal clear charts in every format under the sun. You also benefit from research tools and a handy trading simulator. NinjaTrader is one of the best charting solutions in 2023.
- eSignal – Offers extensive customizability but a relatively limited selection of technical indicators. eSignal is suitable for beginners looking to familiarize themselves with trading charts.
- Sierra Chart – This platform not only offers easy-to-set-up charts, but you also get extensive technical analysis tools. It also offers a demo account, plus real-time and historical data.
If you want free charting software, consider the examples in the next section.
Free Charts
The good news is there are also lots of completely free day trading charts.
When it comes to free online trading charts, you can expect to find most of the same indicators and technical analysis tools that are available in paid-for live versions. Some of the free options even provide a space for traders to follow experienced investors and discuss instruments and markets with each other.
For beginners, these free chart sites are the ideal place to start. They offer top tips on chart reading and some even provide demo accounts. These accounts allow you to invest with simulated money while you build your confidence. They are also ideal for trying out various charts until you find the one that complements your investing style.
Some of the most popular free online trading charts include:
- TradingView – Real-time stock charts for day trading on 1, 3, 5, and 15-minute time frames, among others. You also have access to forex and bitcoin charts, while futures data is delayed. You get hundreds of technical indicators and the ability to set up watch lists and alerts.
- Technician – You get real-time day charts for all US equity markets and forex. In addition, you receive delayed data from global stock exchanges and futures markets.
- FreeStockCharts – Charts for cryptos, futures, stocks, and other big markets. You have 1, 2, 3, 5, 10, and 15-minute time frames to choose between. You can save portfolios, create various chart layouts, and benefit from a whole host of technical indicators and drawing tools.
Final Word on Trading Charts
In conclusion, trading charts are an essential tool for any trader. Free online trading charts can be a great way to get started, offering a range of technical indicators and analysis tools. Make sure to choose the right chart for your needs and take advantage of any demo accounts to build your confidence before investing real money.
Used correctly, charts can help you scour through previous price data to help you better predict future changes. There is a multitude of charting software out there, including several free options. Look for charts with generous customizability options that offer a range of technical tools to enable you to identify telling patterns.
FAQ
Is Day Trading With Charts Easy?
If you are ready to put in the work, day trading with charts can help you assert an edge. Becoming a pro will require a lot of discipline, a good strategy, risk management, and consistency.
How Do I Start Trading With Live Charts?
The best way to start trading with live trading charts is by experimenting with a free demo account. This way you won’t lose real money while learning and refining your approach and favorite charting setups.
Is There Free Charting Software For Trading?
Your broker should offer a trading platform with access to free charting and indicators.
If not, head to websites like TradingView which offers an extensive selection of charts, indicators and trading tools.
What Is The Best Chart For Day Trading?
There is no universal ‘best chart’, however, go for one that provides you with all the market information you need, that is easy to follow and compliments your trading style. You may also want to keep in mind the time frame you want to use as some charts function better on different frames.
What Are The Easiest Trading Charts To Learn?
Some of the most popular charts are line and candlestick. They are beginner-friendly and easy-to-use. Use our guide above which included examples to get started day trading with charts.