
Often somewhere in the 1,000,000 to 100,000,000 range to account for the number of shares traded in any given day.
A single-period ease of movement is calculated by taking the distance computed in the first step and dividing by the box ratio, as follows:
Single-Period Ease of Movement = Distance / Box Ratio
Ease of movement, however, is formed via the same concept behind a moving average. Namely, various single-period ease of movements are added together and divided by the number of periods considered.
This helps to smooth the indicator over time, simplify the process of identifying trends, and find areas of convergence or divergence. (An area of convergence pertains to price running one way and ease of movement moving in the same direction after some previous time apart. An area of divergence pertains to price and the indicator running opposite each other.)
How to Use the Ease of Movement Indicator
Example #1
Some traders use a break above or below the zero line in order to enter into a trade. Above zero readings are bullish and therefore a potential indication to enter into a buy/long trade. Below zero readings are bearish and therefore a potential indication to enter into a sell/short trade.
To avoid false signals, traders might prefer to only take trades where the indicator is a certain threshold above the zero line. In certain consolidating markets, the indicator will frequently pass above and below zero.
For example, on the daily chart of the S&P 500, one might choose to only go long once the ease of movement indicator runs above 10,000.
Similarly, they may also only go short once the indicators runs below -10,000.What this particular level is will be dependent on the asset itself.
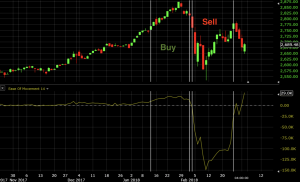
Between the first two vertical white lines represents a buy/long signal with the indicator above 10,000 and closed out once back below 10,000.The second pair of vertical white lines represents a sell/short signal with the indicator below -10,000 and closed out once back above -10,000.
Example #2
Ease of movement can also be used to confirm other indicators.
For example, if one is using a breakout above or below the Bollinger bands as a trade signal, the signal may be confirmed by observing that ease of movement is also above or below zero in the relevant direction.An exit from the trade could include either a break down below zero (or some specified level) on the ease of movement or, for instance, a touch of the middle band on the Bollinger bands.
For example:
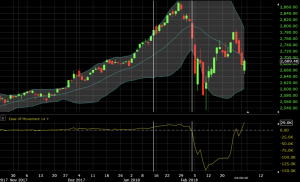
The first vertical white line indicates the entry point while the second line denotes the exit point of the trade.
We can also see from this chart that the strength of the downtrend – as denoted by the ease of movement – is much greater than previous uptrend.