
The positive volume index (PVI) fulfils the same use as the negative volume index (NVI). That is, volume can help inform future price movement. The PVI increases on days when volume has increased from the previous trading day.
The premise behind the PVI is that the “not-so-smart” money is most active on the higher volume days and is more emotionally reactive to movements in the market caused by higher volume. One should note that while this assumption may tend to be true overall, it is not always necessarily a fact, which can undermine the usefulness of the indicator.
Because volume tends to increase in trending markets, the PVI will have a high correlation to price and typically follow the general trend.
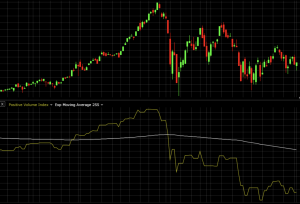
(Positive volume index plotted against a daily chart of the S&P 500)
The PVI is normally used on the daily timeframe, though it can also be used on larger charting time compressions (e.g., weekly, monthly). Note that many charting software programs only accumulate volume data at the daily level or higher. This makes it best suited for swing or position traders, who hold assets over the course of days, weeks, or months.
Calculation of the Positive Volume Index
If today’s volume is greater than the previous day’s volume, then the PVI will change according to this formula:
PVI = Yesterday’s PVI + [[(Close – Yesterday’s Close) / Yesterday’s Close] * Yesterday’s PVI
When volume is less than or equal to the previous day’s volume then the formula is simply:
PVI = Yesterday’s PVI
Usage Alongside the Negative Volume Index
The positive volume index is often used in tandem with the negative volume index (NVI).
With the NVI, the indicator increases when volume decreases from the day before under the assumption that the “smart money” is active on lower volume days.
If one trusts this presumption as sound – i.e., “smart money” active on low volume days and “not-so-smart money” active on high volume days – one might plot both indicators and look for divergences to signal trading opportunities.
For example, a buy/long opportunity might be viewed under the following circumstances:
- Positive volume index declining (i.e., “not-so-smart money” getting out)
- Negative volume index increasing (i.e., “smart money” getting in)
In the following image, we can see a couple decent instances of this playing out where the ellipses are placed in the PVI and NVI charts:
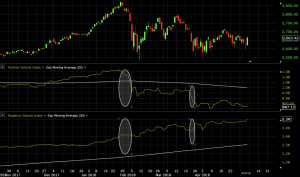
In both cases, the PVI is declining and the NVI is flat to increasing.
Also note that the moving averages associated with each can indicate broader scale direction as well. The indicators normally come paired with 255-day moving averages (there are approximately 250-255 trading days per year). In the case of this market, it shows that since the drop in the market toward the middle of the chart, the “not-so-smart” money has been selling (i.e., PVI declining) while the “smart” money has been buying (i.e., NVI increasing) as the market is viewed as becoming cheaper.
Using the Positive Volume Index within a Trading System
The common strategy, as mentioned in the preceding section, is to use the PVI in tandem with the NVI.
Дивергенції між двома показниками розглядаються як потенційні можливості для торгівлі.
Щоб підвищити точність таких сигналів, трейдери можуть вибрати пару з цією стратегією з формою наслідування тенденції. Простий рухомий середній або набір рухомих середніх може допомогти досягти цього.
Нижче ми бачимо дві певні дивергенції між PVI та NVI. PVI (прямо нижче графіка цін) зменшується, тоді як NVI (нижній графік) збільшується. Це бикова настройка, що свідчить про те, що “розумні гроші” входять, тоді як “не такі розумні гроші” виходять. В той же час 100-денний простий рухомий середній ухилений додатньо, що також сприяє торгівлі в довгій позиції.
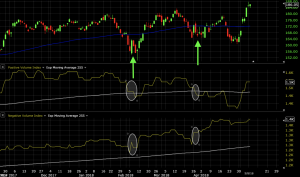
Тому, коли ми бачимо чітку дивергенцію між двома в биковому сенсі (PVI вниз, NVI вгору), при цьому 100-денний простий рухомий середній також підтримує торгівлю, це може підтримати биковий вхід. Цей тип бикової настройки буде найбільш поширеним, коли ринки знижуються. А саме, “розумні гроші” купують під час спаду, “не такі розумні гроші” продають через волатильність, а загальна позитивна тенденція активу підтримує додатньо нахилений рухомий середній. Це тип настройки, який підтримує максиму “купуй дешевше, продавай дорожче”.
Висновок
Позитивний обсяговий індекс вказує на те, коли “не такі розумні гроші” найбільше активні на ринку.