
Donchian channels is an indicator used to assess the volatility of a market. It takes the highest high and lowest low of the previous X periods (X is user-defined, but generally set at a default of 50). The difference between these two points constitutes the channel over this period.
On charting software, Donchian channels are placed over the price chart to help traders visualize where current price is relative to the upper and lower bounds of the channel. A middle line can also be added to provide the midpoint between the channels (not shown below).
If we use a 50-period setting, the indicator would appear as follows:
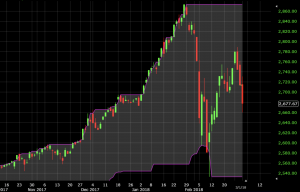
(Daily chart of the S&P 500)
Over the recent timeframe, the market set recent 50-day highs and lows. The Donchian channels reflect this by displaying a range between these points.
In general, the shorter the period, the more compressed the channels will be. Larger data sets will tend to produce broader ranges.
Uses of the Donchian Channels
If prices are more stable, then Donchian channels will be relatively tight.
If prices are less stable, then the channels will be wider.
The way a trader uses this information depends on their broader strategy. Most traders use directional strategies and rely on volatility to generate profit. Some traders take advantage of quieter market environments by using strategies that work if volatility remains contained. These strategies can include calendar spreads or buying an in-the-money call and put option to maximize profit if the asset’s movement remains range-bound.
Donchian channels can be used to enter directional trades on their own. For example, if the price breaks above its X period high, it can be interpreted as a long trade being established. Conversely, if the price breaks below its X period low, it can be a signal for a short trade. An exit signal can be generated using the midpoint line or a different indicator.
This makes the Donchian channels a trend-following indicator if interpreted in this manner.
Example
Looking at a daily chart of the S&P 500 with a 50-day period for the Donchian channels using the rules above, we see two setups in the past nine months. The first was a moderate winner, while the second was a big winner.
Donchian channels can be used on smaller time compressions, such as the hourly chart, 15-minute chart, 5-minute chart, and anything in between. The smaller the time compression and lower the period of the channels, the more frequent the signals will be. However, note that more frequent signals do not necessarily equate to more trading profit.
Conclusion
Donchian channels indicate the volume of a market by showing the difference between the high and low of the past X number of periods. While some traders use the channels as a gauge of volume, others use them for actual trade signaling.