
Gamma is the rate of change in delta (∆) with respect to changes in the underlying price of a security.
Gamma is known as what’s called a second-order Greek. It’s the second derivative of the value function (i.e., value of an option) with respect to an asset’s underlying price (S).
Gamma = ∂∆ / ∂S = ∂^2V / ∂S
Being “long gamma” generally means being long options. Being “short gamma” generally means being short options.
When long options increase in value, delta increases as well. The rate of change that that delta leads to the concept of gamma.
Gamma increases as an option nears the at-the-money (ATM) point and declines the further out-of-the-money (OTM) or in-the-money (ITM) it is.
Call Gamma (blue) vs. Delta (red)
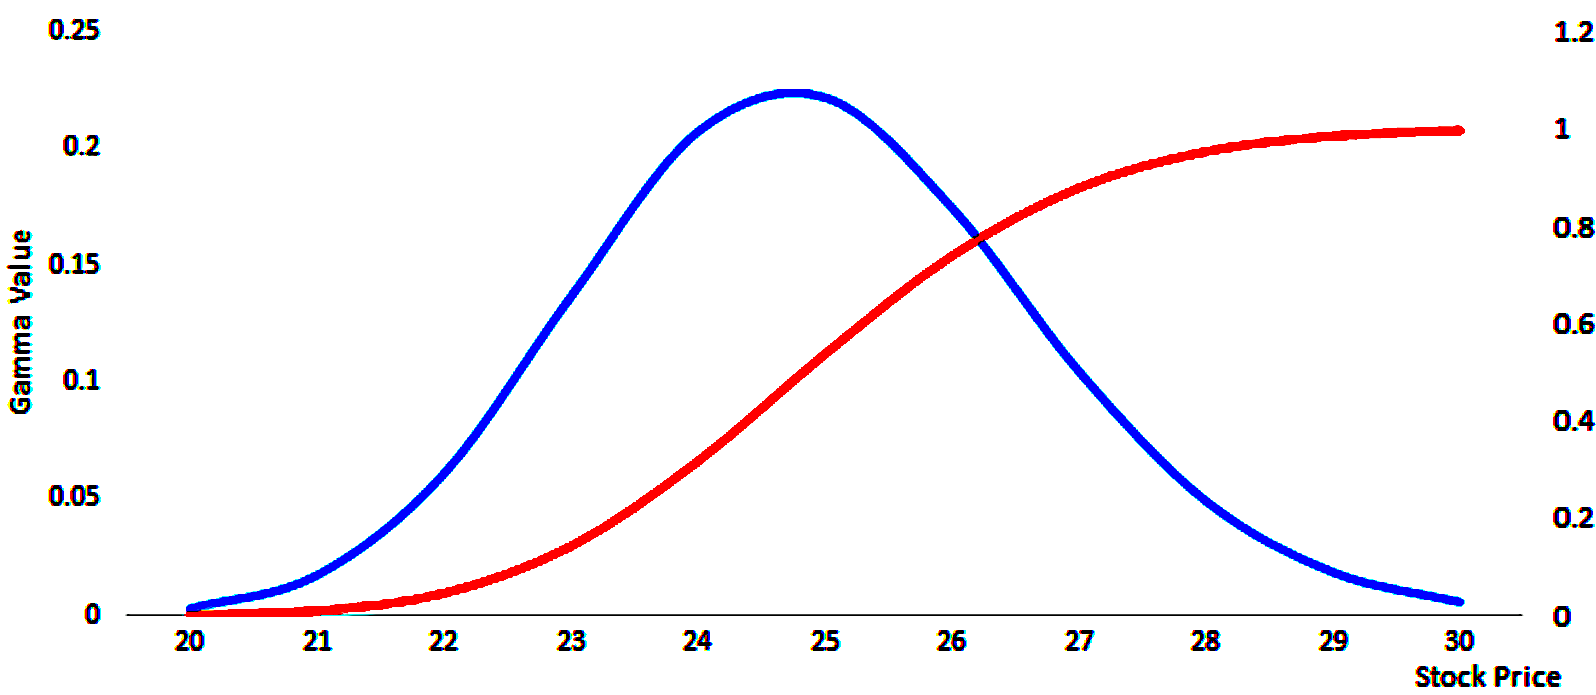
As gamma increases, delta goes from 0 to about 0.50 for long call options; and from 0 to about minus-0.50 for long put options.
Delta (red) looks like a logistic growth function.
Its rate of change (gamma) is highest in the center before inflecting and the rate of change becomes lower, though still positive.
This information is reflected in the blue curve. It shows that when an option is ATM and begins to go ITM, an option begins to act more like the underlying asset. Delta’s rate of change thereby decreases, which causes gamma to decrease.
Gamma is lowest for deltas of 0.0 and 1.0 for call options and lowest for delta of 0.0 and minus-1.0 for put options.
(The inverse is true for short call and put options.)
Exceptions
It is generally understood that “long gamma” involves being long options and “short gamma” involves being short options.
The exception to this is when there is negative convexity in the payout function.
Convexity is normally positive when being long options.
This is because you pay a fixed premium for the option, and if you get a favorable move, delta increases non-linearly (positive gamma). That gives options a type of leverage or a type of convexity in the potential payoff structure.
Negative convexity is rare. But it does exist in some circumstances and in some parts of the financial markets.
When convexity is negative that means the shape of a bond’s yield curve is concave.
For example, most mortgage-backed securities (MBS) – i.e., bonds that are tied to mortgage lending and subsequent servicing of that – exhibit negative convexity.
This is because of refinancing risk.
In most mortgages, a homeowner takes out a fixed-rate loan.
If interest rates fall below the rate they have on their mortgage, many will try to refinance their mortgage.
This helps lock in lower monthly payments and is favorable for the borrower.
But for the investors in mortgage-backed securities, it’s riskier because they are holding onto a bond that’s likely to be paid off faster than what they initially believed.
When interest rates fall, the prices of these mortgage-backed securities rise less than other bonds of similar maturities.
This is due to the fact the amount of time that’s expected to elapse between when the security was issued and when it matures has decreased.
Consequently, most mortgage bonds exhibit negative convexity. Derivatives tied to them may also pose a similar type of relationship due to the inherent concavity in the underlying.
How Traders Use Gamma
Traders know that gamma is highest approximately ATM and gets lower the further an option is OTM or ITM.
Since gamma is essentially the convexity of an option’s value, traders will think of it from the perspective of risk/reward.
Shorting OTM options can lead to losses in a non-linear way if left uncovered, so traders need to either avoid such exposures or be adept at hedging them.
This is especially important when option expiration is close.Options values erode with time (theta).
OTM options near expiration can change significantly in value even if there’s an otherwise normal move in the underlying.
For some traders it might be compelling at the end of a week, just before options expiration in many securities, to try and squeeze out some extra P/L by shorting options very near expiration.
But it can backfire when a small move in the underlying can lead to a loss of multiples of the premium.
Delta hedging works on small price movements. But because of the convexity of an option’s value, it doesn’t do a good job of protecting exposures as it pertains to larger swings in movements of the underlying.
This is where gamma hedging comes in.
An effective delta hedge for a portfolio works on only a small range of price movements in the underlying, so a trader may also try to neutralize the portfolio’s gamma.
This helps ensure that the portfolio is hedged across a wider variety of price movements in the underlying should they occur rapidly. This could be due to a data release – e.g., macroeconomic data, earnings – or anything that changes the discounted set of expectations that drives the price.
Delta Hedging vs. Gamma Hedging
Delta is the first derivative of the profit and loss curve of the underlying. Gamma is the second derivative of the profit and loss curve.
Hedging involves offsetting adverse exposure in these regards by using a combination of the underlying asset, derivatives, and other exposures to get the desired delta or gamma, whether that’s zero, positive, or negative, depending on what the trader is trying to do.
Delta Hedge Example
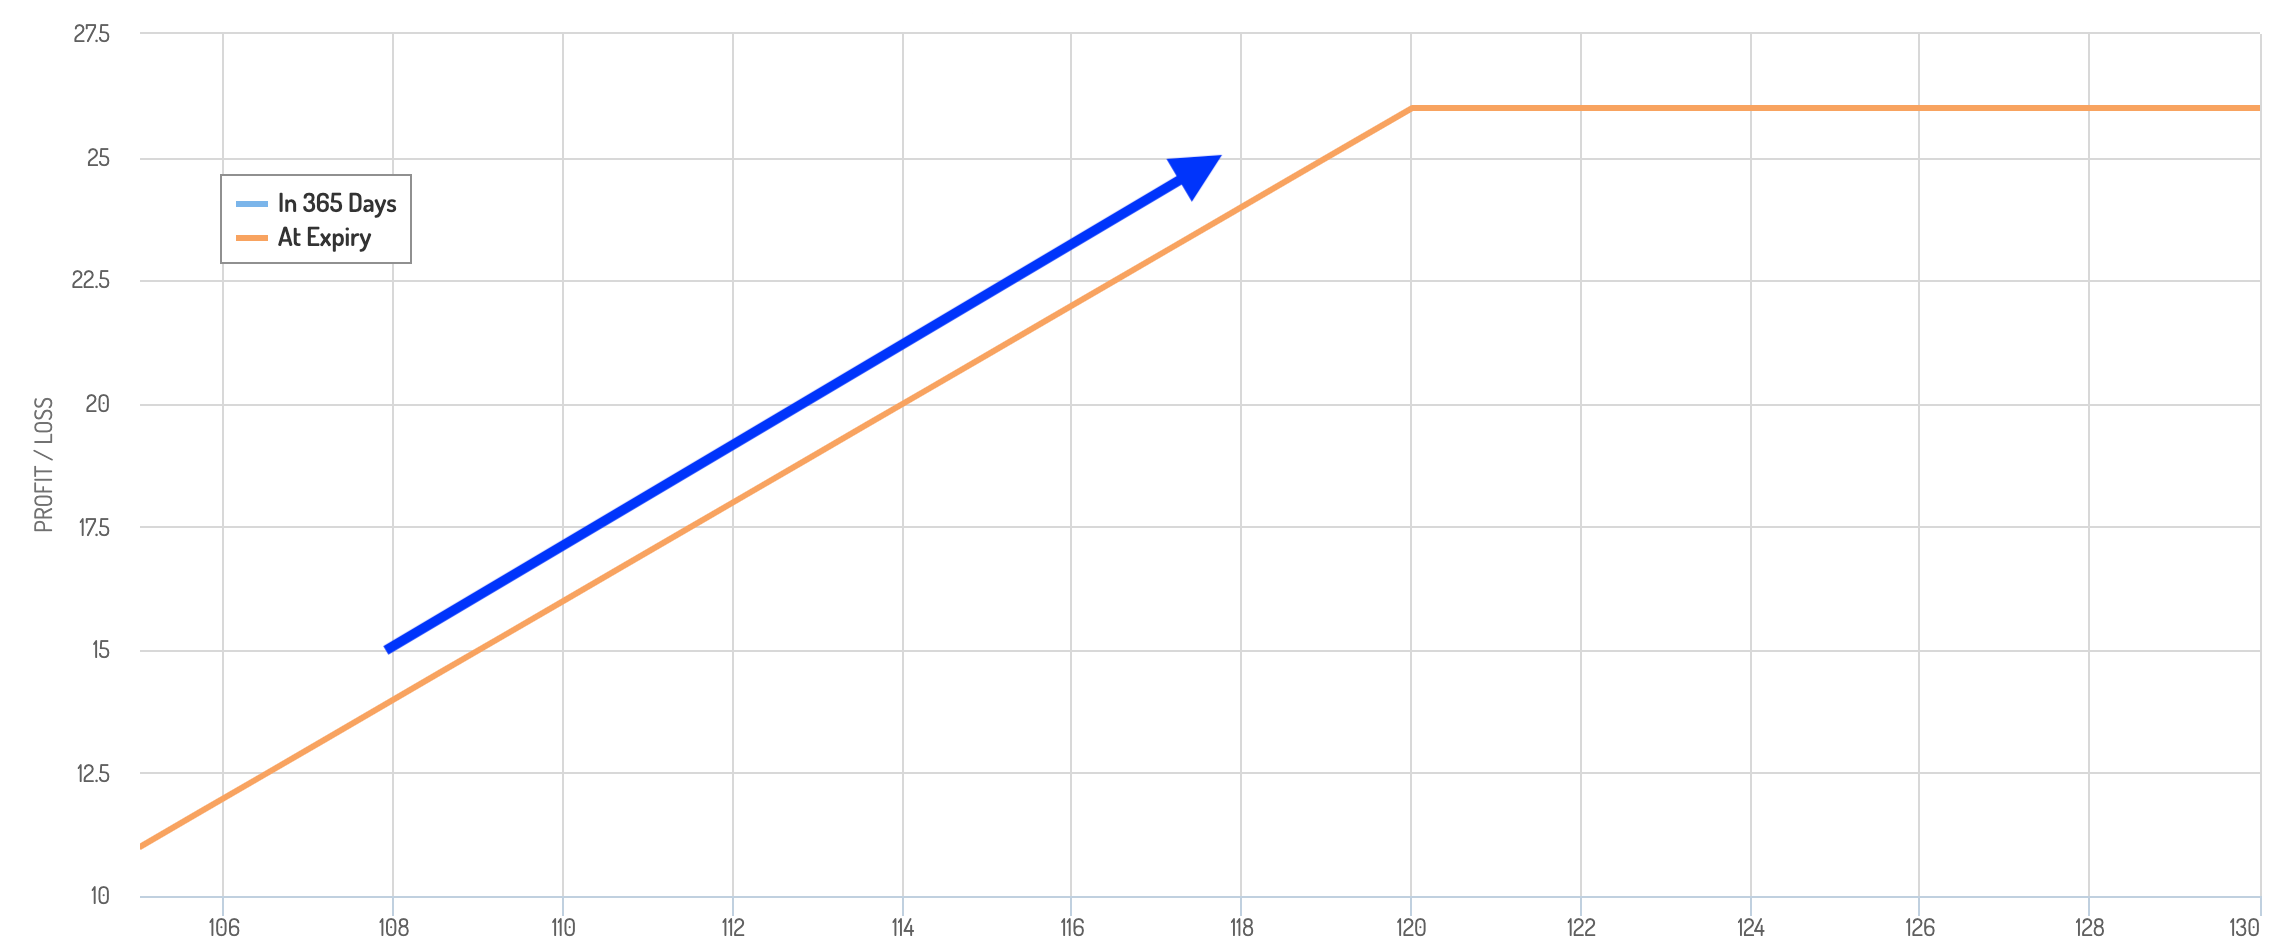
A basic delta hedge could be shorting call options and going long a certain number of shares of the underlying based on the delta of the options and the overall exposure from the options.
That looks like the following.
You have that linear delta-1 exposure, but cap it off at a certain price under the standard covered call structure. Also, if the underlying decreases in price, some of that loss is offset by the options premium received.
Alternatively, one could own shares of a stock and go long put options to help neutralize adverse left-tail exposure.
Gamma Hedging
We’ll go through a couple examples.
Example #1
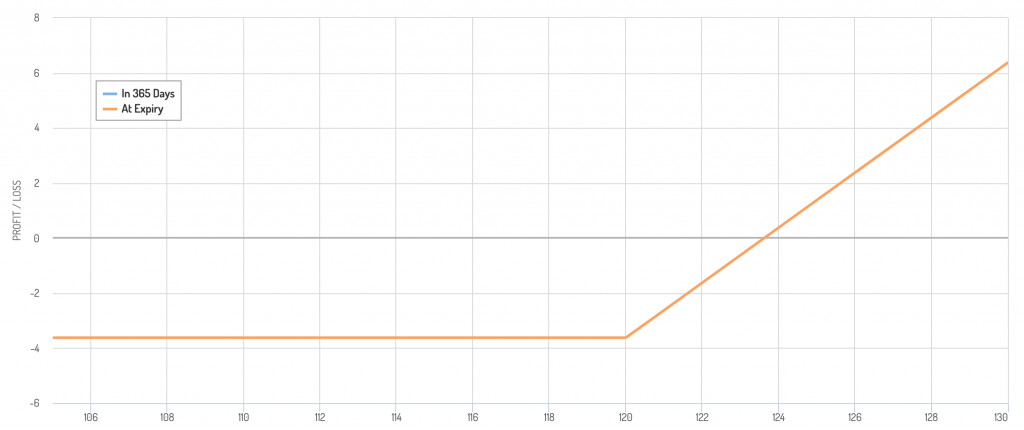
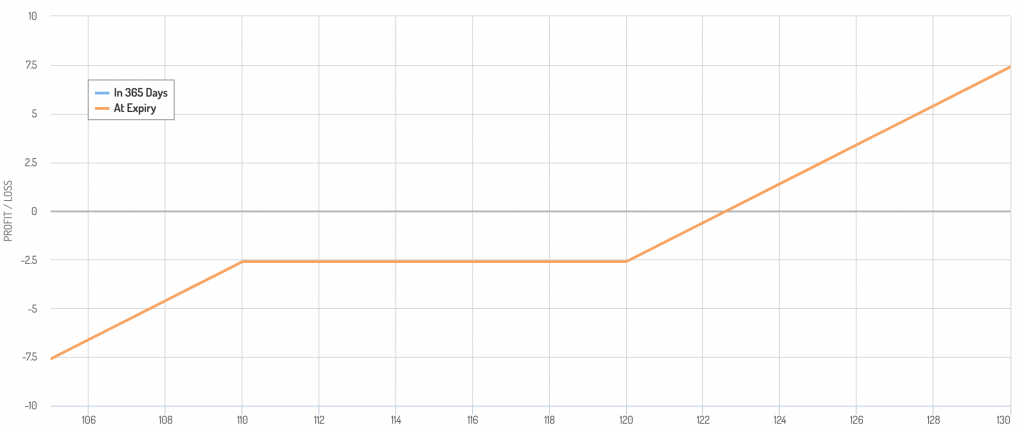
An example of a gamma hedge is when someone buys a call option, which gives positive delta and positive gamma, then sells a put to hedge out the gamma but give even more positive delta. (If that put goes ITM, you agree to add long exposure to the underlying asset.)
In terms of a payoff diagram, let’s say the underlying is 115, you buy a call with a 120 strike and sell a put with a 110 strike.
You have a “dead spot” in the 110 to 120 range, where your P/L is fixed. It moves higher above 120 due to the call and falls lower below 110 because of the short put when you effectively start to become short the underlying.
Because of your concentrated delta exposure, you would be exposed to large movements in the underlying.
Gamma (red) vs. Gamma of Gamma (green) graph

In summary, gamma hedging is a strategy used to protect against fluctuations in gamma by utilizing offsetting positions in the underlying asset and options contracts.
While it can reduce risk in one area, it can also create additional risk in others, and traders must carefully consider the trade-offs involved.
Understanding the first, second, and third derivatives of an option’s value with respect to the underlying asset is crucial to effectively executing gamma hedging strategies.
Gamma (green) vs. Speed (orange)
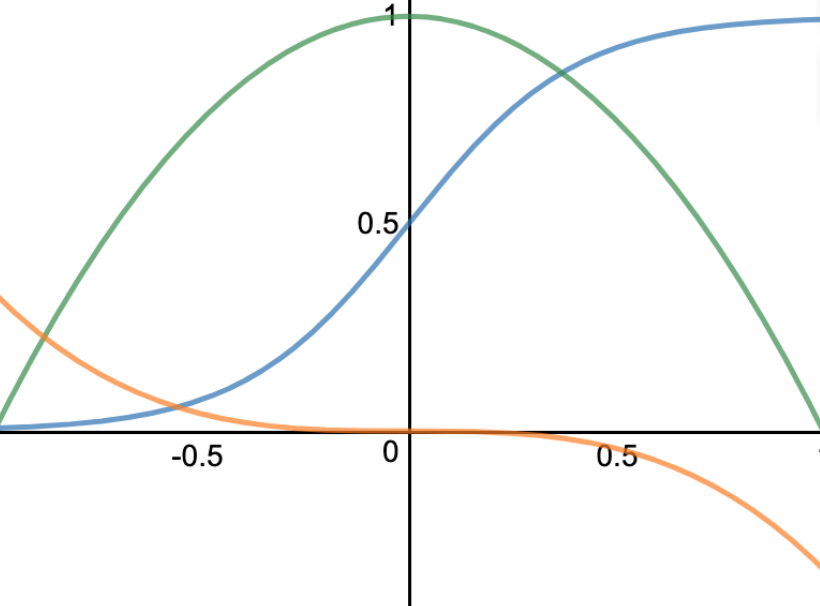
Hedging One Thing May Bring Unintended Exposures In Other Things
As you hedge higher-order derivatives, you can also expose yourself to changes in other sensitivities, such as volatility and time, and their higher-order derivatives.
In the gamma hedging examples above, neutralizing a second-order effect ended up giving a more concentrated delta (a potentially adverse first-order effect).
Portfolio construction involves trade-offs between first-order and subsequent-order effects.
It’s natural to overweight first-order effects and pay less attention to subsequent-order effects because they may not be visible or deemed as important, but this can create surprise unintended exposures.
Hedging Is About Lowering Exposure, But Not Necessarily Eliminating It
Traders often seek a hedge that is delta or gamma neutral, but not always.
A trader may also want a specific delta position based on their view of the underlying asset. Are they bullish or bearish? That could determine whether they want a positive or negative delta (i.e., bullish or bearish exposure to the underlying).
The delta could be positive or negative while the gamma remains neutral. Moreover, traders often want a positive gamma.