Forward P/E
The main difference between trailing P/E and forward P/E is the time frame used to calculate the ratio.
Trailing P/E uses the past twelve months of earnings, while forward P/E uses estimates of future earnings.
Forward P/E is more speculative and may not be as accurate as trailing P/E, but it can provide insight into a company’s growth potential.
Investors should consider both ratios when evaluating a company’s stock.
Conclusion
The P/E ratio is a commonly used tool for evaluating a company’s stock.
It compares the share price to the company’s earnings and can provide insight into the company’s value and growth potential.
Investors should be aware of the difference between trailing P/E and forward P/E and use both ratios when evaluating a company’s stock.
Forward P/E
The Trailing P/E is typically the more commonly quoted version of the price-earnings ratio, as it represents earnings that have already been listed on the company’s income statement. These figures are updated on a quarterly basis and include four quarters of data. In contrast, the Forward P/E ratio is determined by analyst estimates and projections. Some estimates may use operating earnings, which discount the effect of one-time gains or losses, or extraordinary items that are not representative of normal operations.
It is worth noting that the Trailing P/E is generally higher than the Forward P/E, as earnings tend to increase over time, causing the denominator (earnings) to rise in value and thus lower the ratio.
How To Interpret The P/E Ratio
The P/E ratio provides investors with an estimate of how long it may take to pay back an investor’s principal through dividends and distributions based on its current earnings run rate. For instance, a stock with a P/E ratio of 20x is expected to pay back an investor’s principal in roughly 20 years. If the stock is trading at $100 per share and earning $5 per share annually, it would take 20 years for the investor to essentially match their principal based on those $5 in earnings per share. The P/E ratio includes the element of time, with years being the common standard.
Public companies report earnings on a quarterly basis, although EPS usually implies that the unit of time is at the annual level unless otherwise noted.
A Measure Of Value
The P/E ratio is a widely used measure of value.
It helps investors determine how shares of various companies may be valued relative to each other.
P/E ratios also vary quite a bit by industry.
In lower-growth industries like financials or industrials, P/E ratios tend to be lower.
In higher-growth industries like tech, their P/E’s tend to be higher.
When companies are trading at very high P/E’s, such as 50x or 100x or more, this generally denotes that the market expects them to be earning a lot more in five or more years to justify that valuation.
On the flip side, a single-digit P/E ratio (i.e., 10x or less) does not necessarily mean that the stock is cheap.
It could mean that the company is viewed as being in secular decline and seeing negative growth and/or earnings that are not sustainable going forward.
Some investors depend on P/E as a measure of value and lean on the ratio for buying stocks at a perceived bargain.
Others place little emphasis on the measure. All of a market’s expectations are already embedded within the price.
While higher P/E stocks may be better companies, they also tend to be more expensive. This brings with it the implication that their forward returns may be lower accordingly.
Like in sports betting, it is pretty easy to make predictions about what teams will be superior to others. But it’s not easy to convert that knowledge into winning bets because of how their prices reflect all that is currently known.
Similarly, it is not easy to simply buy low P/E stocks and sell (or short sell) high P/E stocks and come out ahead relative to a representative benchmark.
P/E also reflects a limited timeframe.
The cash flows of stocks are theoretically perpetual, so the influence of future expectations a long time out has an influence on the stock’s price.
P/E reflects only the past year of earnings history relative to the current stock price or an estimate of earnings projections one year forward. But markets are always discounting growth and risk many years or decades in advance.
P/E As A Measure Of The Earnings Yield
The inverse of the P/E represents the earnings yield of a company. If a company’s P/E is 20x, then the reciprocal of that number – 1 divided by 20 – is the earnings yield, or 5 percent.
The investor could interpret that figure as the investment generating a return of 5 percent per year.
There is, of course, matters related to risk, growth, and the stability of earnings to take into consideration.
While it might take 20 years for earnings to cover the price, earnings are quite unlikely to stay constant over time.
Index Wide P/E Ratio
We can also look at P/E not at the level of not just the individual security, but at the level of the index.
The S&P 500 is a market cap weighted index. Each individual component prices add up to form the total value of the index.
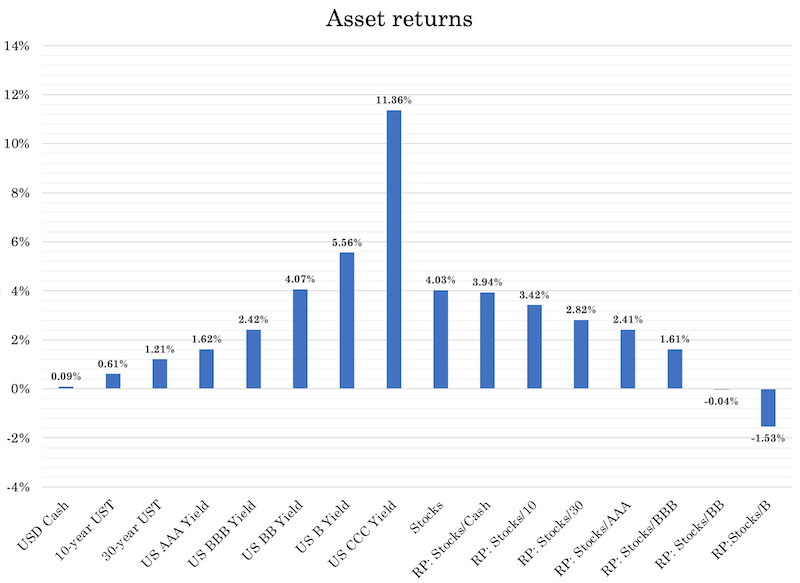
For example, if the S&P 500 is earning 140 and the index is priced at 3,473, then the P/E is 3,473 divided by 140, or slightly more than 4 percent.
We can also compare this alongside other asset classes and look at the risk premiums (“RP”) between them:
What Is The P/E Ratio Of A Company With Negative Earnings?
Technically, a company’s P/E can be negative, but it is generally expressed as “not available or N/A” if its earnings are zero or negative.
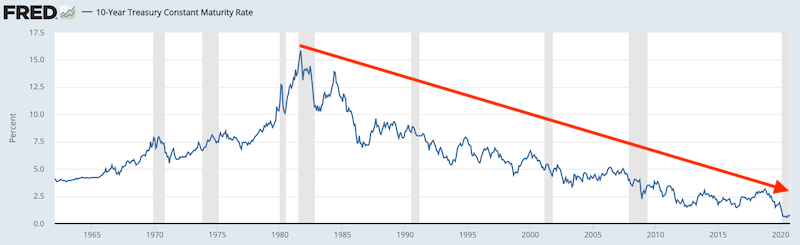
Historical P/E Ratios
The average P/E for US-based public companies typically varies between 10x and 20x since the beginning of the 20th century, with the mean somewhere in the middle.
P/E rates vary based on capital gains taxes, transaction costs, and the prices of competing investments.
When cash and safe bonds offer higher yields, more investors become attracted to these safe assets in relation to riskier stocks, compressing the P/E multiple.
Likewise, when cash and bond yields are low, more investors turn toward stocks due to inadequate returns elsewhere.
This increases their prices relative to their earnings, sending P/E multiples higher.
Sometimes they can go to extreme lows or highs depending on the economy and other market conditions.
In the US, the P/E ratios of equities reached a low of 4.8 in December 2020 during the 1920-21 recession and a high of 44.2 in December 1999 near the peak of the tech bubble.
Though 10x to 20x has been considered a normal range, what is sustainable depends on economic growth, tax rates, and the prices of other investments in relation.
Many academics and investors have noted the inverse correlation between high P/E ratios and low forward investment returns.
Starting P/E ratios vs. 10-year returns
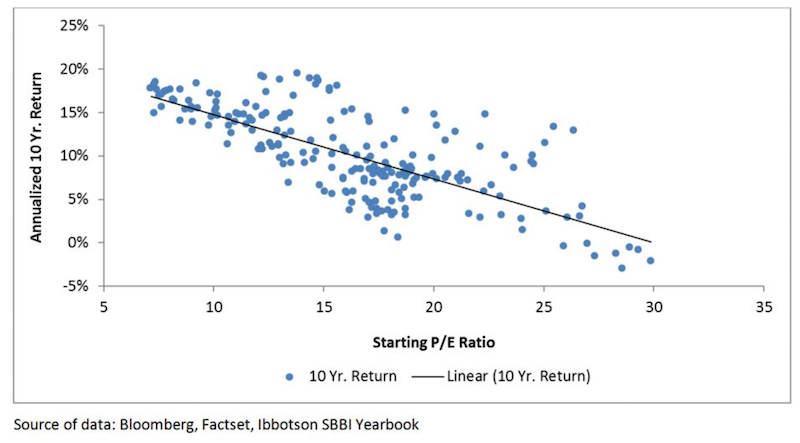
It shows that once P/E ratios get above the 25x mark, 10-year forward returns average a little bit less than zero.
When they get below 15x, the next ten years often see annualized returns of 10 percent annualized or higher.
The general idea is the standard “buy low, sell high”. But this is harder to do in practice.
Markets classically top when all available buyers are off the sidelines and liquidity is being drawn out of the financial system by the central bank (usually from the tightening of money and credit from higher interest rates).
Markets also classically bottom when people need to sell assets to make their payments and a huge amount of stocks, bonds, and other financial securities are up for sale.
Central banks come in to put more money and credit into the system by lowering short-term interest rates, and if necessary long-term interest rates as well by creating money and buying financial assets.
P/E ratio And Its Use Among Management Teams
Management teams are often paid in stock or stock options in their company.
This is used to align the interest of those running the company, or officers within the company, with those of other shareholders.
Generally, the stock price can increase via the business either earning more or by achieving a higher multiple (i.e., a higher P/E ratio).
A higher P/E ratio can be achieved through higher future growth rates, or creating the perception that the company will grow more in the future. It can also be achieved through lower rates of return on other investments like cash and bonds, which incentivizes more investors to move into stocks.
As a result, managers want to boost earnings per share in the present while also improving growth rates in the future.
This could lead management to do the following:
i) Find ways to make earnings steadier over time. Investors generally reward greater reliability in earnings (and/or higher earnings) through a higher share price.
Management teams may consider diversifying the risk by building multiple revenue streams and additional business units.
For example, an oil and gas company may choose to have both upstream (exploration and production) and downstream (refining) units. Those engaging in exploration and production generally benefit from higher oil prices because selling oil is the business. Refineries, who purchase oil, tend to benefit from lower oil prices.
ii) Management may want to acquire a high-growth leg for their company.
This may mean buying a company with a higher P/E ratio.
This may also help with getting the market to positively re-rate the company with more of a growth multiple.
iii) Companies that use their own stock to buy higher growth companies may face dilution to their own share price in terms of the way the EPS math works.
This can knock the share price as investors prefer to not be part of deals that are dilutive.This entails the issuance of stock in excess of the earnings they are acquiring.
As a result, cash or debt funding may be preferred for the acquisition of higher-growth companies.This adds earnings while keeping the share count the same, therefore boosting EPS.
iv) Companies with lower P/E ratios may choose to take on more debt instead of equity.
Debt is cheaper than equity, given debt’s seniority in a company’s capital structure, and it doesn’t dilute ownership.
A higher debt to equity capitalization may help improve a share price by keeping earnings per share higher than it would be otherwise.
This, of course, assumes that the debt piled on the balance sheet doesn’t cause stress that would actually hurt the share price.
Outside the financial engineering component, debt also of course conveys spending power.In turn, it can be used to make investments that boost earnings.
v) Companies may choose to report greater stability in earnings by doing their financial reporting and accounting in a certain way.
They may choose to pull forward certain revenues in one quarter while delaying expenses to a future quarter during “down” quarters.
Or they may defer revenue into future quarters or pull forward certain expenses in “good” quarters.
This may help smooth out earnings over time while growing them at the same time.Investors reward reliability and growth.
The P/E Ratio And Its Relevance Today
P/E ratios among developed market stocks are higher than they normally are.
We’re in a zero interest rate world and will be for a while.This is the most important theme governing financial markets currently and has material implications for portfolio construction and how to think about valuations.
In the developed world, cash rates are zero practically everywhere.In some places (e.g., developed Europe, Japan), they are negative.In the US, some parts of the curve briefly went negative, anticipating that the US could be forced to go this route as well, though the Federal Reserve is likely to use other tools.
Short-term interest rates: US, Japan, UK
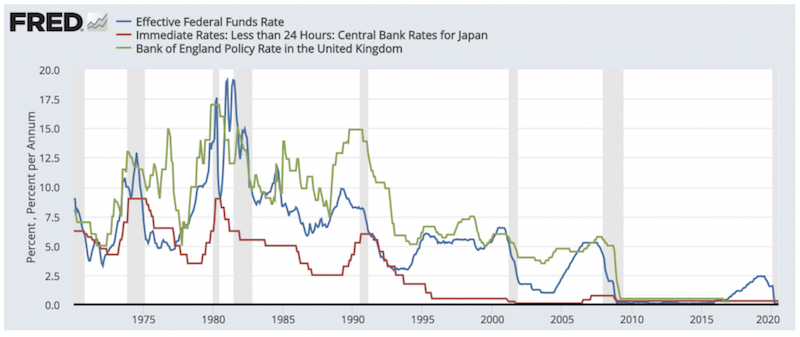
(Source: St.Louis Federal Reserve)
When cash rates are low, this tends to pull bond rates down with them.
Central banks have also pressed longer-term interest rates (i.e., those associated with bonds) down very close to zero or below zero to provide additional assistance to the economy.
When everything else is low yielding, stocks bend down to these types of yields as well.
By extension, this means we’re in a period where the forward returns of practically all financial assets will be low across the board.
There will be winners and losers within asset classes, but these are difficult to predict as the range of knowns is already priced in.
While such central bank support is necessary, it makes markets susceptible to persistent overvaluation, which you’ll see in the form of high P/E ratios.
The forward returns are lower, but the risks remain the same or are in some ways elevated.
The yield of stocks is more difficult to determine relative to cash and bonds because they don’t come with advertised rates.
With fixed income securities, you always know the yield. The only time that yield differs from what’s always published is if the issuer defaults.
Equities convey ownership in a business that represents the cash available to shareholders after everyone else has been paid.
Stocks are perpetual cash flow instruments.
While P/E can get at the earnings of the previous twelve months or estimate the next twelve months to get at an earnings yield, this level of earnings fluctuates throughout time.
Their longer duration and uncertainty in future cash flows makes their structural volatility higher.
What we do know is that stocks, over the past 50 years or so, have had an extra 3.2 percent annual return over 10-year Treasury bonds.
Portfolio Assets
| Name | |||||||||||||||||||||||||||CAGR | ||||||||||Stdev | Best Year | Worst Year | Max. Drawdown | Sharpe Ratio | Sortino Ratio | Calmar Ratio |
|---|---|---|---|---|---|---|---|---|
| Equities | 10.2% | 17.0% | 56.8% | -37.0% | -50.9% | 0.57 | 0.99 | 0.20 |
| Bonds | 5.4% | 4.4% | 39.2% | -8.1% | -25.5% | 1.07 | 1.74 | 0.21 |
| Commodities | 2.6% | 17.3% | 61.9% | -43.0% | -62.7% | 0.11 | 0.19 | 0.04 |
| Real Estate | 7.3% | 16.0% | 38.0% | -29.4% | -55.1% | 0.40 | 0.67 | 0.13 |
| Cash | 1.9% | 0.3% | 3.7% | 1.5% | 0.0% | 0.15 | 0.24 | 0.09 |
| Drawdown | Sharpe Ratio |
|---|